A new report from the Aircraft Owners and Pilots Association Air Safety Institute shows that the number of general aviation accidents rose in 2021, but an increase in flight hours helped “mitigate increases in accidents.”
“The overall total and fatal accident rates for 2021 continued trending downward, finishing with a total accident rate of 4.28 per 100,000 hours and a fatal accident rate of 0.77 per 100,000 hours,” according to the report. “A large increase in flight activity helped mitigate increases in accidents. Overall, flight activity rose from 22.4 million hours in 2020 to 26.4 million hours in 2021.”
The 33rd edition of the report, which was renamed from the Joseph T. Hall Report to the Richard G. McSpadden Report to honor McSpadden, who lost his life in an airplane accident Oct. 1, 2023, in Lake Placid, New York, was released Nov. 17, 2023.
The new report includes data from 2021, as it takes the NTSB approximately two years to issue a probable cause statement on accidents.
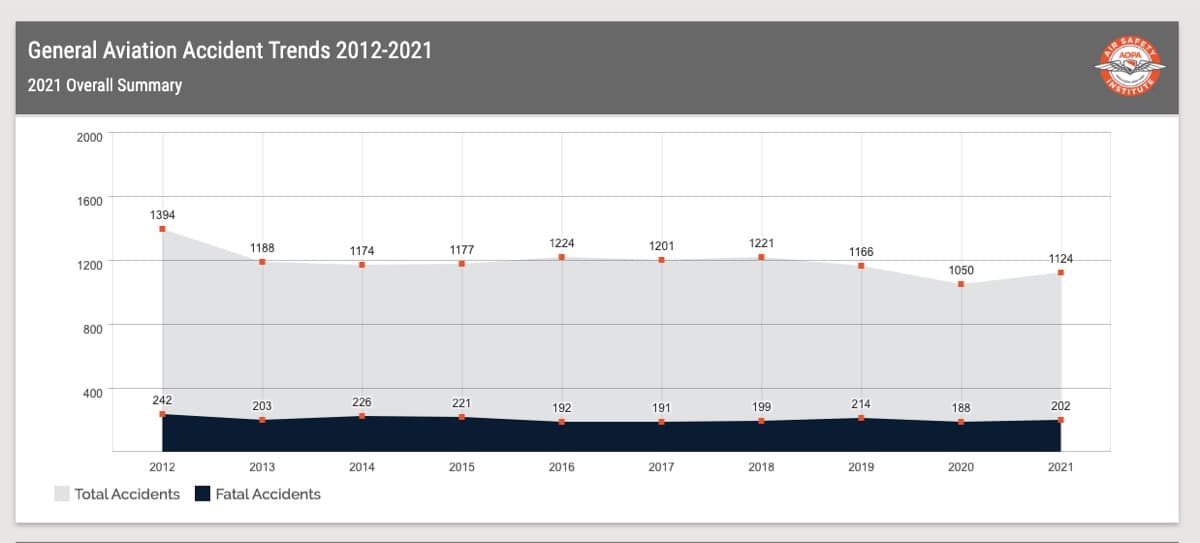
The report notes an increase in total accidents from 1,050 in 2020 to 1,124 in 2021, including 202 fatal accidents. However, 4 million additional flight hours — compared to the previous year — helped offset the increase in accidents, according to AOPA officials.
Overall accident rates decreased from 4.69 per 100,000 flight hours to 4.28, while the fatal accident rate decreased from 0.84 to 0.77 from 2020 to 2021.
According to the report, “stall/loss-of-control events continue to be the leading causal factor and weather-related accidents remain highly lethal.”
These causes of accident causes — related to pilot decision-making and proficiency — help inform the industry, including the AOPA Air Safety Institute, where further education and training are needed to improve aviation safety, officials said.
The report points out that non-commercial fixed-wing accident rates decreased slightly with the fatal accident rate declining to 0.86 and the total accident rate decreasing to 4.87.
“An area where we see some discouragement is the non-commercial helicopter accident rate, which rose following two years of decline,” said Robert Geske, AOPA Air Safety Institute manager of aviation safety analysis. “We are also disappointed to see the lethality rate for weather accidents remain steady at an average of eight per year despite continual efforts to address this area.”
Non-Commercial Fixed-Wing Data
Non-commercial fixed-wing aircraft had 938 total accidents, of which 166 were fatal.
With overall accidents trending upward — following a large increase in flight activity for this category — the accident rate (4.87) trended downward. Non-commercial fixed-wing aircraft showed an increase in fatal accidents (166), with the fatal accident rate falling (0.86) helped by increased flight activity.
The percentage of pilot-related accidents remained around 70%, according to the report.
Pilot-related accidents totaled 647 total, of which 103 were fatal.
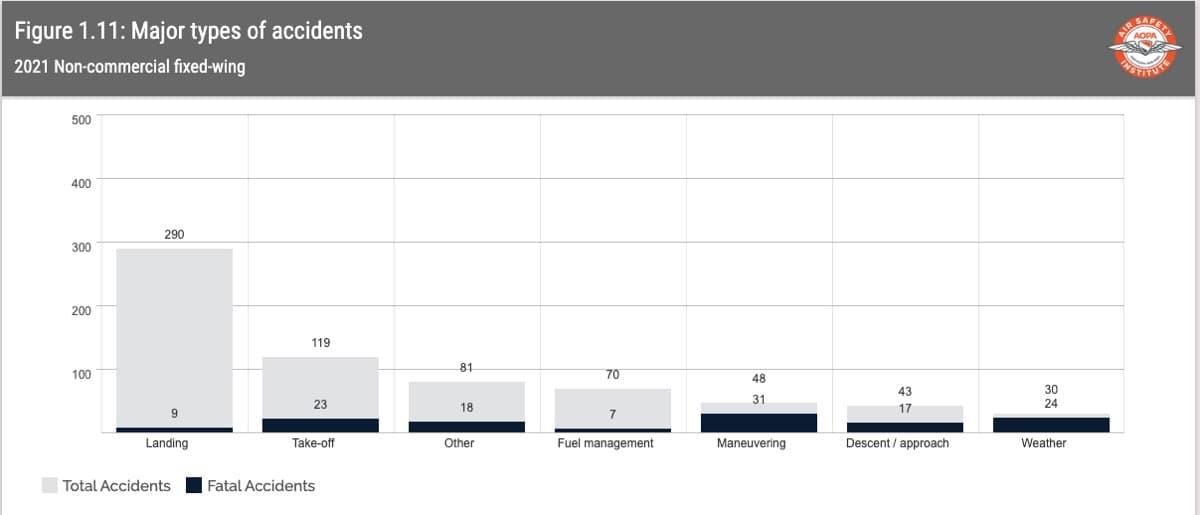
Landing accidents still accounted for the largest number (290) “but thankfully suffered few fatal accidents” (nine), according to the report. Loss of control (147) continued to dominate as the leading cause of landing accidents.
Takeoff and climb accidents (119) fell from the previous year. The largest number of accidents (43) were loss of control, followed by stalled or settled on takeoff.
Fuel management (70) rose slightly from the previous year, with systems operations accounting for the largest total number of accidents (40).
Maneuvering accidents increased in both total (48) and fatal (31) from the previous year.
Stall/LOC had 23 accidents, of which 18 were fatal. Descent and approach accidents decreased to 43, with collisions (16) as the largest cause.
Weather accidents increased in total (30) and fatal (24) accidents. VFR into IMC led with 12 accidents, of which 11 were fatal.
Mechanical-related accidents increased in total (151) and had a small decrease in fatal accidents (12) from the previous year. Powerplant issues (57) continued to lead, followed by gear and brakes (34), and fuel system (23), which accounted for the majority of mechanical accidents.
The report also breaks down accidents in the sport and experimental category, as well as commercial fix-wing, non-commercial helicopter, and commercial helicopter operations.
You can see the full report here.
The report’s accident data are updated on a rolling 30-day cycle allowing for the most current snapshot of general aviation safety performance. You can view data from 2008 to the current year.