
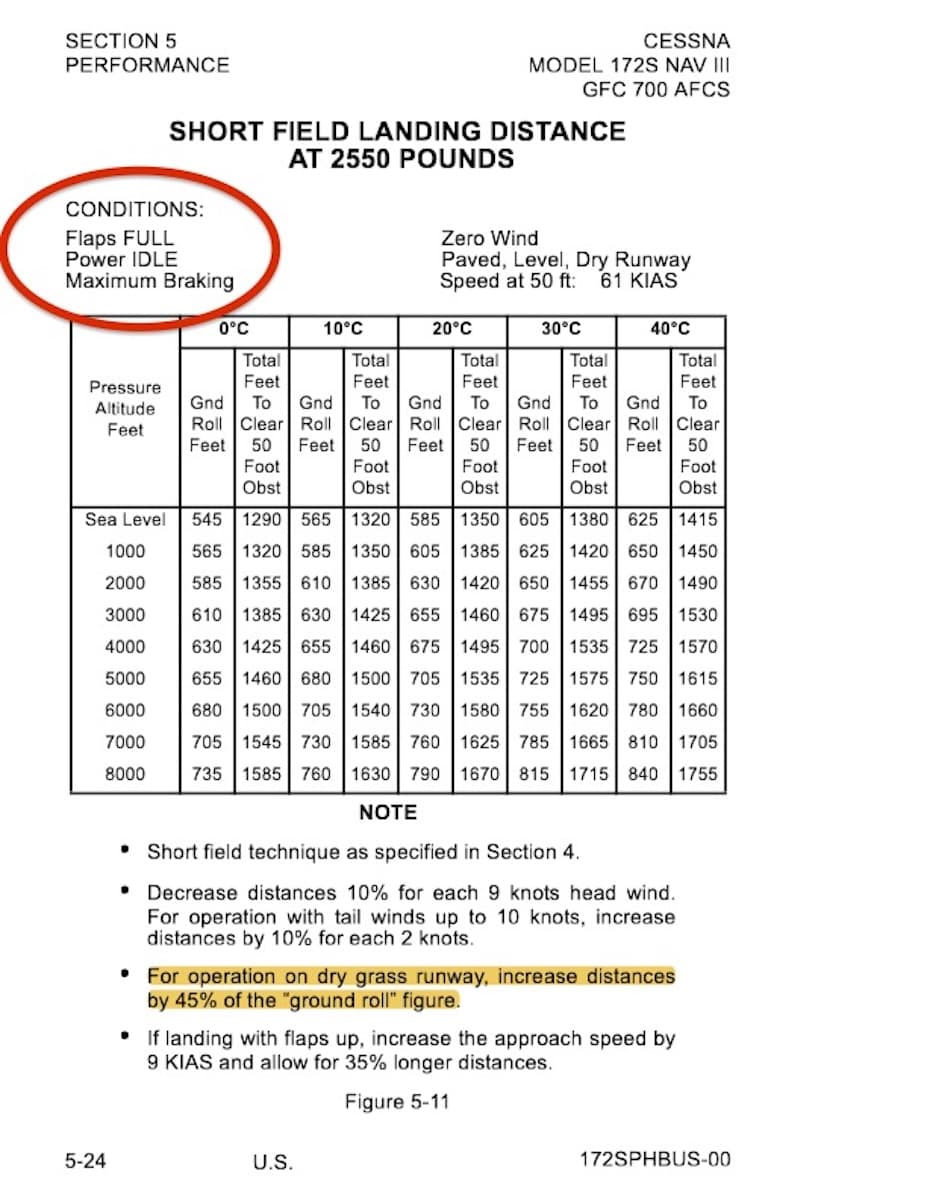
Justin, a student pilot in Florida, writes: I’ve been studying the performance charts in my Cessna 172’s POH and was surprised to see a note on the short field landing table that said to add 45% to the figures for landing on grass. Why do you need more landing distance on a soft field? Shouldn’t the surface friction slow the plane down more than on pavement?
Good for you, reading your POH with critical thinking skills! And you are correct that if we landed two identical Skyhawks on parallel grass and pavement strips and both pilots used soft-field technique, the pilot on the grass would have a shorter ground roll from increased friction compared to the pilot on the pavement.
So what is up with this 45% more for grass business? Doesn’t this violate the laws of physics?
It would if we were comparing apples to apples, but Cessna has mixed apples and oranges on its charts for the newer versions of the venerable Skyhawk.
Rather than have one table for short field landings and another table for soft field landings, the company created a combined chart. Well, more correctly, it used one chart and provided a conversion formula that allows you to convert the apples to oranges all by yourself and, as you noticed, placed the formula below the chart in small print under the heading “NOTE.”
If you take any number on the short field table, and increase it by 45%, you now have soft field data. As to why those new numbers are illogically greater distances, it’s because the landing techniques for soft fields and short fields are not the same.
To understand what’s happening, take a look at the CONDITIONS of the chart in the upper left. Here you will see that the numbers on the chart were calculated using Maximum Braking after touchdown, the standard practice for short, paved runways — but not something you want to do on grass. So that extra 45% is the compensation factor between heavy brakes for short paved field landings and no brakes for soft field landings.
This is why it is important to read any fine print on any performance chart and to take the time to understand the conditions under which the data was collected.
I’m sure at least one person has wrecked a perfectly good airplane after casually looking at this chart and “logically figuring” they could land in less space on grass.
Does a plain old “dry grass” airstrip really qualify as a “soft field”? Is dry grass the best ‘unit of measure’ to use if you’re landing on some other un-paved surface? Always a great topic for a Hangar Fly …or for starting a bar fight…
First, let’s establish that “Short Fields” and “Soft Fields” are not the same, unless it’s a short, soft field. Also, “procedures’’ and ‘‘techniques’’ are not the same things.
Why does Cessna, along with other manufacturers, only provide detailed procedures and data for ”Normal” and “Short Field” operations, but not so much for “Soft Field” stuff? While they might briefly mention Soft Field takeoffs in their POHs, they shy away from landings completely. I think there’re a couple reasons.
Since there isn’t an official definition of what makes a runway ”soft”, there’d be too many variables to consider when defining procedures for soft field operations: Runway surface conditions, density altitude, wind, slope, obstructions, a/c weight & configuration, and on and on… that’s a lot of stuff to factor into the landing distance equation!
There is no official definition of “short runway” either, but manufacturers can provide flight-test-derived takeoff & landing distance data, based on specific atmospheric and runway conditions (i.e., “hard”), and aircraft configurations, and then print the POH procedures needed to achieve those same results. Being a factory test pilot would help too.
OTOH, the FAA discusses “Soft-field Approach and Landing” in the Airplane Flying Handbook (FAA-H-8083-3C): “Landing on fields that are rough or have soft surfaces, such as snow, sand, mud, or tall grass, requires unique procedures”.
While the FAA’s “approach” piece is pretty generic, their “landing” guidance is specific to nose-wheelers, and their “unique procedures” are really more ”technique only”. That includes the practice of carrying some power, if required, to land a trike as slow as possible while protecting the prop; a technique that will likely add some extra distance.
But increased distances also result from different braking techniques and friction/effectiveness, on surfaces that are wet vs. dry, standing water vs. just soggy, snow vs. ice, tall grass vs. short grass, bumpy vs. flat, smooth vs. rough, snow, sand, mud, gravel, etc., and that affects both taildraggers and trikes.
When it comes to figuring distances, as the article mentioned, Cessna makes you do your own soft field landing calculations, by starting with published “Hard Surface Runway” or “Paved, Level, Dry Runway” numbers, and then applying their “Dry Grass Runway” correction formula (Rule of Thumb?) to give you some reasonable (my words) margin of safety. They just don’t tell you exactly how to fly it in their airplanes.
In fact, Cessna includes this exact same Dry Grass Runway “Note” on the Landing Distance Tables for both taildraggers (C-185) and tricycles (C-150): For operation on a dry grass runway, increase distances (both “ground roll” and “total to clear 50 ft. obstacle”) by 20% of the “total to clear 50 ft. obstacle” figure.
While dry grass might be “soft”, it’s a lot closer to ‘paved’ than many of the other un-paved surfaces we like to operate from. Is it a ‘one size fits all’ solution when doing pilot math for those other surfaces? Not hardly; but it’s better than nothing.
It looks like Cessna’s formula accounts for both distance-increasing factors: Slowing down in ground effect (“total to clear 50 ft obstacle”), and reduced braking effectiveness once you’re on the ground (“ground roll’). Which of those factors actually adds more distance? In a nose pusher, probably both. In a taildragger, I’m going with braking.
My taildragger soft field technique is pretty much the same as my short field one; stabilized approach to a power off, full-stall 3-pointer, brake if/as required based on the surface conditions and available stopping distance. I’m not carrying any extra distance-adding power in a taildragger …unless I’m afraid I might get stuck in the muck after touchdown. I’ll adjust as required if strong/gusty winds are a factor; I’ll try to save the wheel landings for when I just want to show off.
Finally, as noted in the article, in the 1976 Cessna 172M POH, it merely states “For operation on dry grass runway, increase distances by 45% of the ‘ground roll’ figure.” If you apply the same C-185 and C-150 formula instead, the differences are less than 15 feet.
Regardless, like the author, I’m a big believer in always reading the fine print…
https://airfactsjournal.com/2019/08/always-read-the-fine-print/
I think we are conflating ‘soft field’ with ‘short field’ braking technique.
Wet grass can have zero braking effectiveness. Treat wet grass like ice.
I think the use of power on soft-field landings is the major reason for the longer landing distance. FAA handbook – “The approach for the soft-field landing is similar to the normal approach used for operating into long, firm landing areas. The major difference between the two is that a degree of power is used throughout the level-off and touchdown for the soft-field landing.”
A good reminder that performance charts are only as reliable as the runway conditions they are based on.
Grass, gravel, and other unsealed surfaces can significantly affect takeoff and landing performance. Beyond aircraft capability, runway preparation, drainage, surface consistency, and loose material all play a critical role in safety and operational reliability.
This is why investing in well-engineered airstrips is so important. A stable, dust-free, properly drained surface provides more predictable aircraft performance, reduces foreign object debris (FOD), lowers maintenance requirements, and enhances year-round accessibility.
Infrastructure on the ground is just as important as performance in the air.
Contact us to upgrade your airstrip or runway [email protected]
https://www.soilsolutions.com/solutions/airstrip-solutions/
It would be fun to see a similar article disicussing the takeoff. I don’t worry about landing my 150 in pretty short strips. My focus is on getting back out again. In the Midwest, almost every short field has trees at both ends.
I’m surprized that I can’t find more detailed/updated distance charts for early Cessnas (’67) as the early POH’s are pretty brief.
Thank you.
Early Cessnas we’re flown by real men,charts were for the outhouse !
That’s why so many of them landed 40 feet up in that tree !!