If you happen to live at Florida’s Spruce Creek Airpark (7FL6), a picture may be worth many thousands of words.
Pilots at the airpark, for years, have sought to create a notch in Daytona Beach International’s (KDAB) Class C airspace. The southern part of the inner ring at KDAB, from the surface to 4,000 feet, is close to 7FL6’s left-hand pattern Runway 06.
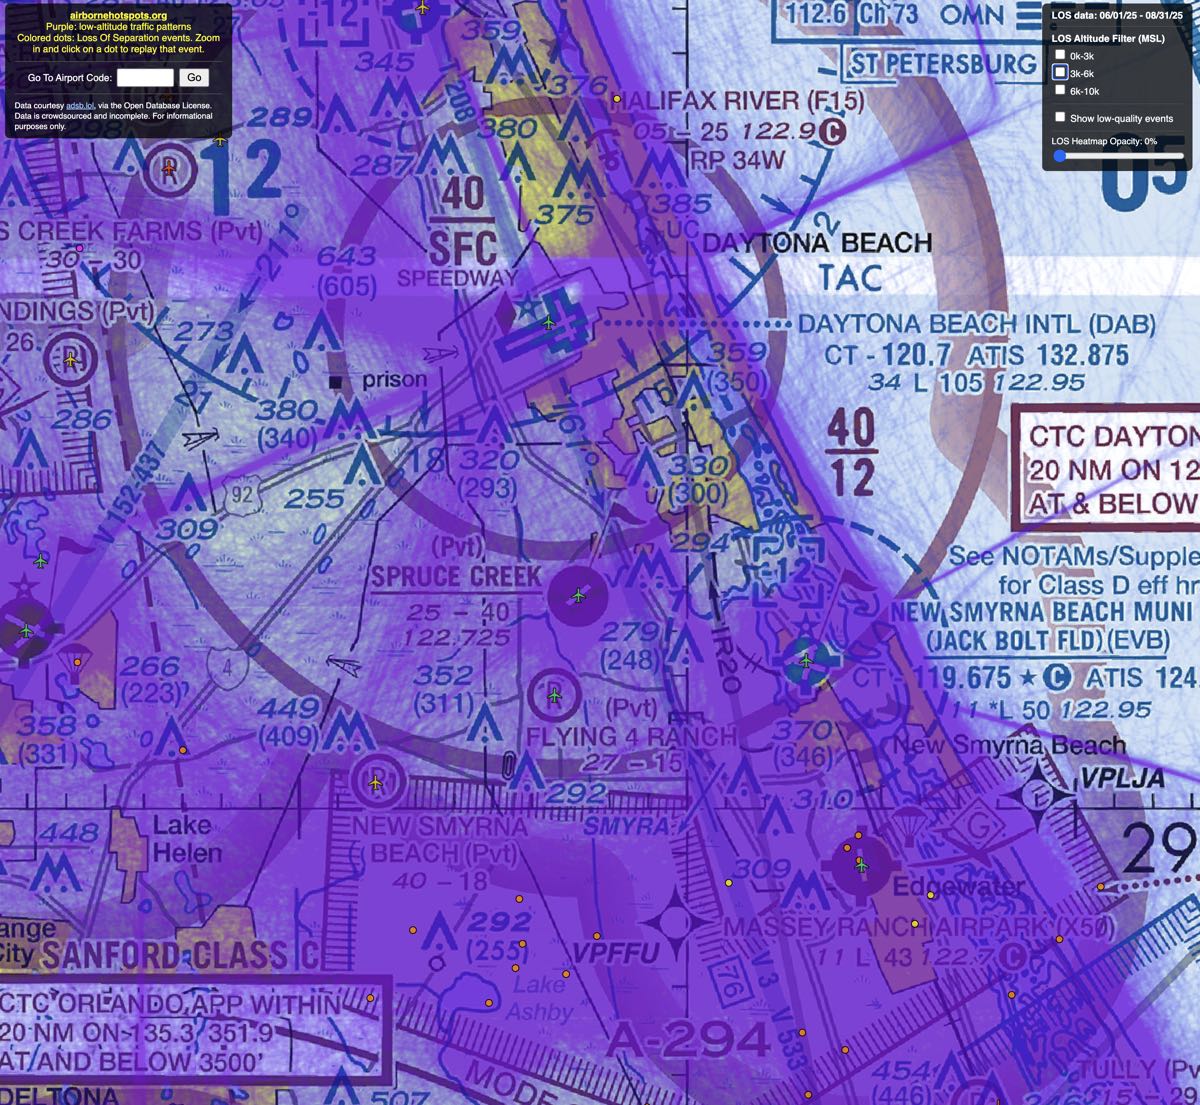
Want to see how close? Pull up the Airborne Hotspots website and type 7FL6 into the search box.
They’d like a bit more breathing room.
But there’s more to the picture.
When you focus on the ADS-B reported traffic, shown with purple lines, you also see where the traffic is and isn’t flying.
KDAB’s traffic, inbound from the south and outbound to the south, fly routes to the east and west of 7FL6. The KDAB traffic is pretty easy to see using the Airborne Hotspots website.
KDAB’s Class C airspace just inside the inner ring, just north of 7FL6, has the least amount of traffic in the immediate area around Spruce Creek.
Seeing traffic data laid out on a sectional chart brings the data to life.
When Paul Eastham, creator of Airborne Hotspots, filled me in on his work to help Spruce Creek, he also offered his services, at no charge, to other airports around the country with airspace issues.
He also pointed out a few updates to the website since we last spoke.
- The Aircraft Icon adds ADS-B data quality. Green for good, yellow for fair, and red for poor.
- When clicking on any of the Loss-of-Separation (LOS) dots, the animation of the event appears on the map instead of a pop-up window.
- The LOS Heatmap Opacity (upper right of window) defaults to 0%. Move the slider left and right to adjust the heat map to your preference.
- LOS Events (upper right of window) can now be filtered by altitude range. Sea level to 3,000 feet MSL, 3,000-6,000 feet MSL, and 6,000-10,000 feet MSL. Deselect any range you are not interested in to reduce the number of LOS event dots.
- Deselect all altitude ranges to see traffic flow — highways in the sky if you will. The darker the purple, the heavier trafficked the route is.
Use Caution
As our conversation wound down, Paul pointed out another example of a potential improvement for pilots.
Just west of California’s San Martin Airport (E16) on the sectional, a teal box states, “USE CAUTION: High volume traffic, 11,000 to 4,000 Coyote Creek Golf Course to San Martin Airport.”
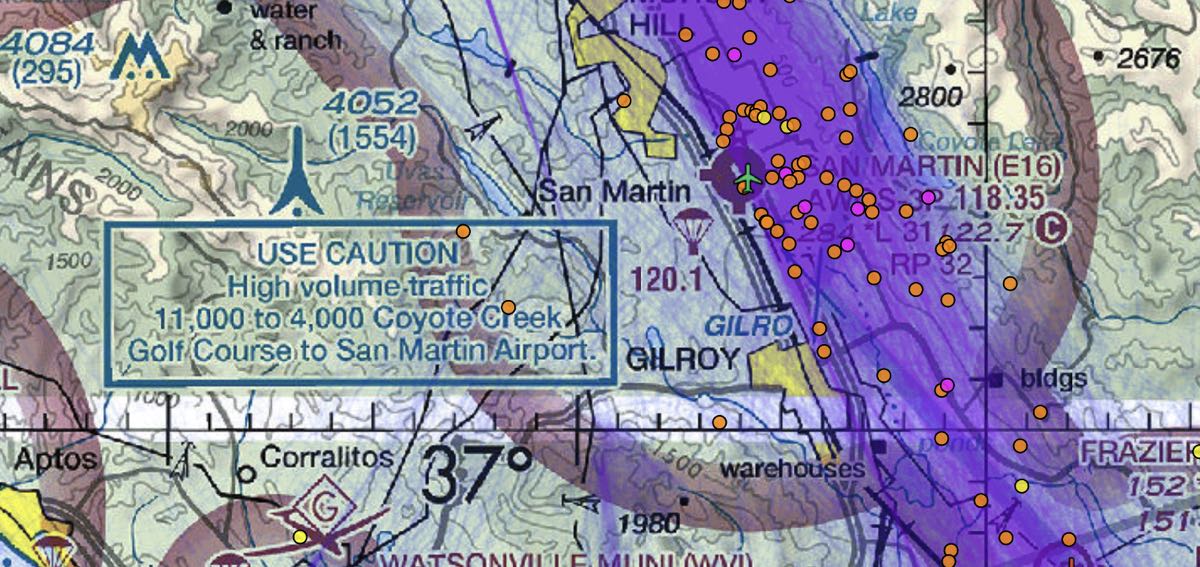
“That’s great for local traffic,” said Eastman. “But if you aren’t from the area, where on the chart is the Coyote Creek Golf Course?” Better, or more thoughtful, guidance would be helpful for all pilots.
Eastham designed Airborne Hotspots to help see traffic routes over time. Originally he wanted to see airborne traffic routes so he could record the number of Loss-of-Separation events at 88NV. That’s Black Rock City, which is the temporary airport serving the Burning Man festival in the Nevada desert.
Instead of using a thousand words to improve airborne safety, maybe we can just improve the picture a bit.
I fly 182RG with over 16 years of GA experience out of both 7FL6 and 47N and the app LOS just gave me a better understanding of how to study and make a better set up for VFR approach in as well as out of the airspace around all airports….
This app should be added to Fore Flight/ Flight-Aware etc…and also part of ground school training…Lov it!